
Cricket's Duckworth-Lewis method: how to work out who wins when rain interrupts
By Dr Russell Gerrard, Associate Professor of Statistics, Cass Business School, City, University of London.
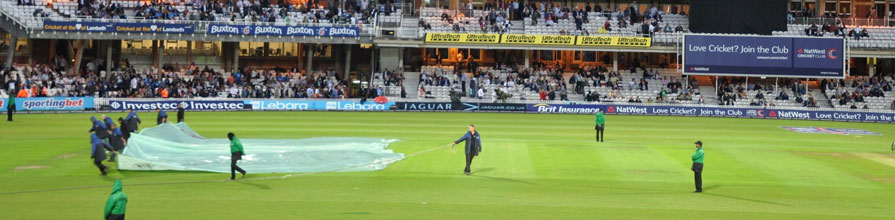
When both teams involved in a one day international cricket match have their full allocation of overs, the team scoring the most runs is the winner. There is, however, a regrettable tendency for the weather to intervene – especially in England, as the World Cup 2019 teams have been finding out – and to deprive one or both teams of a portion of their allotted time. The solution, as it turned out, lay in statistics.
Early attempts to compensate for the lost overs, such as the average run rate or the most productive overs method, were perceived as favouring one or other of the two teams. But in the mid-1990s, the original Duckworth-Lewis method was formulated by two cricket-loving statisticians, Frank Duckworth and Tony Lewis, in an effort to ensure that the target score for the team batting second in a weather-affected match was neither unreasonably hard nor unreasonably easy to achieve.
The central principle underlying the method is that a team’s score should be judged in the context of the “resources” available to them. So a team begins an innings having used 0% of the resources. As balls are bowled, or as wickets are lost, their resources are used up. Duckworth and Lewis came up with a formula that used the exponential function to calculate the proportion of resources used in terms of the number of overs still to go and the number of wickets taken.
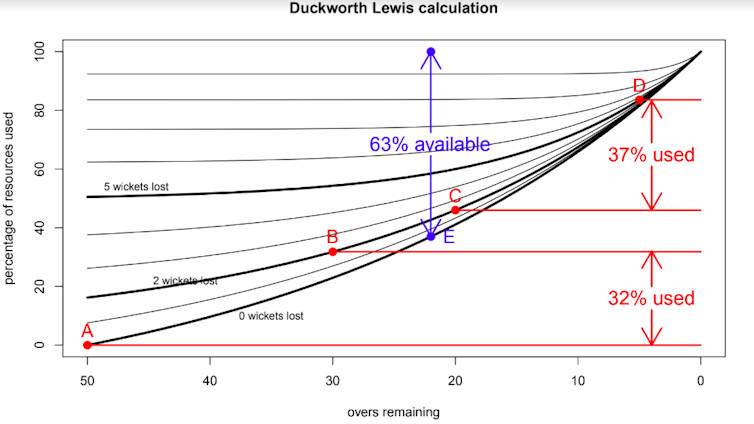
The Duckworth Lewis formula.
Author provided
The illustration above shows how the Duckworth-Lewis calculation works in a specific case. The team batting first (in red on the diagram) bats for 20 overs, during which time two wickets are lost (from point A to point B). There is then a break for rain, after which the match is reduced to 40 overs per side, so the team resumes with the expectation that they have 20 more overs to bat (point C). They get through 15 of these overs, losing a further three wickets, but then the rain returns and puts an end to their innings at 150 for five (point D).
The diagram shows that the first period of batting used up 32% of the resources and the second batting period provided them with a further 37%, with the result that the team had only 69% of an uninterrupted innings. The team batting second has just 22 overs to bat by the time the rain has stopped, but of course has lost no wickets, so starts from point E in the diagram (in blue). As a consequence they are left with 63% of their full innings and their target is calculated as 150 x 63%/69% = 137 runs to win in their 22 overs.
The curve helps to compensate for any advantage which might accrue to the team batting second, which knows from the start of its innings exactly what the target number of runs is and can set out to achieve that with its full complement of ten wickets. The team batting first, of course, will have started its innings believing it had 50 overs to set a target and will have paced its innings accordingly.
The drawback
The exponential shape of the curves in the diagram illustrates a drawback in the original Duckworth-Lewis method: it assumes that the scoring rate increases steadily.
A team chasing 200 would be considered on target if it had scored 76 for two after 25 overs, leaving 124 from the last 25, but (just doubling the numbers) a team chasing 400 with 152 for two on the board after 25 overs, leaving 248 from the last 25, would equally be considered to be on target according to the formula, although in reality this team would be much less sanguine about their chances of winning.
An adjustment was introduced in 2004, which had the effect of flattening the exponential curves in high-scoring matches, making intermediate targets more realistic. The downside, however, is that instead of being able to use a single Duckworth-Lewis diagram for every match, you have to redraw the diagram for the second innings depending on how many runs were scored by the team batting first.
Data science professor, Steven Stern, proposed a further adjustment in 2009 to take account of differences in scoring patterns between the first and second innings. Stern was appointed the custodian of the method in 2014 on the retirement of Duckworth and Lewis.
Duckworth and Lewis’s decision to use exponential curves was to a certain extent arbitrary: there is no particular reason why a parabolic or other convex shape could not have been used instead, and perhaps in this case the adjustments would have been unnecessary.
Another possible variation might relate to how the method is applied, rather than the method itself. It is standard practice to ensure that, in shortened matches, each side is allocated the same number of overs. If, for example, rain comes after 30 overs of the first innings and there is only enough time when the weather clears for a further 30 overs of play, they are all allocated to the second team – even though the team batting second will have 77% of its resources available and the team batting first might have used as little as 41% of its resources (if no wickets have been lost).
Allowing the first team to bat for a further five overs, leaving 25 overs for the second team to bat, might redress the balance somewhat.![]()
This article is republished from The Conversation under a Creative Commons license. Read the original article.